-
Economy
-
5.5
Economic growth
-
9.1
Unemployment
-
2.5
Inflation
-
-
Housing
-
8.8
Market liquidity
-
7.4
Rental prices
-
7.1
Transaction prices
-
-
Consumers
-
3.5
Consumer confidence
-
1.6
Affordability
-
7.0
Satisfaction
-
-
Sustainability
-
5.1
CO2 emissions
-
4.4
Renewable electricity
-
8.8
GRESB
-
-
Trend
Trend
-
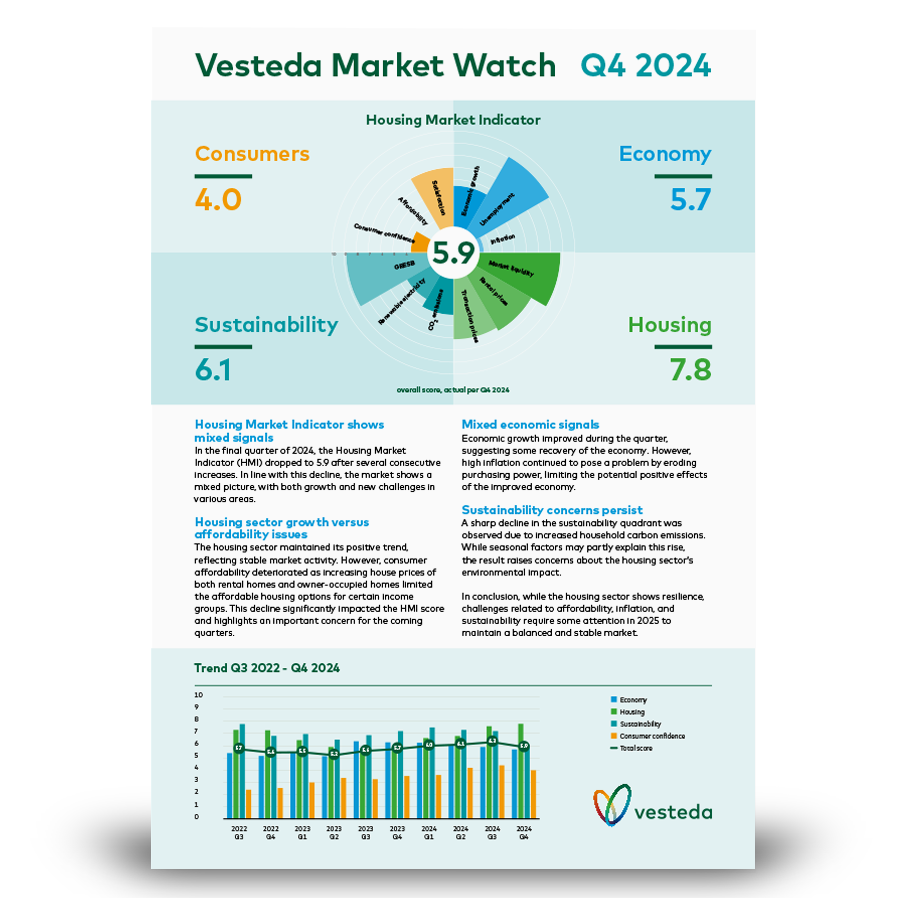
Housing Market Indicator
overall score, actual per Q4 2024
-
Consumers
4.0 -
Economy
5.7 -
Sustainability
6.1 -
Housing
7.8
-
Housing Market Indicator
overall score, actual per Q4 2024
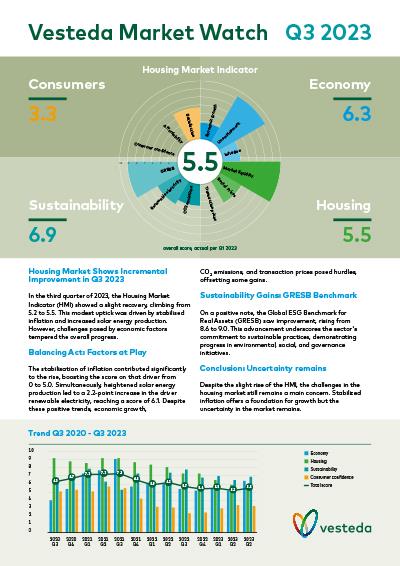
Housing Market Indicator
Housing Market Indicator shows mixed signals - In the final quarter of 2024, the Housing Market Indicator (HMI) dropped to 5.9 after several consecutive increases. In line with this decline, the market shows a mixed picture, with both growth and new challenges in various areas.
Housing sector growth versus affordability issues - The housing sector maintained its positive trend, reflecting stable market activity. However, consumer affordability deteriorated as increasing house prices of both rental homes and owner-occupied homes limited the affordable housing options for certain income groups. This decline significantly impacted the HMI score and highlights an important concern for the coming quarters.
Mixed economic signals - Economic growth improved during the quarter, suggesting some recovery of the economy. However, high inflation continued to pose a problem by eroding purchasing power, limiting the potential positive effects of the improved economy.
Sustainability concerns persist - A sharp decline in the sustainability quadrant was observed due to increased household carbon emissions. While seasonal factors may partly explain this rise, the result raises concerns about the housing sector’s environmental impact.
In conclusion, while the housing sector shows resilience, challenges related to affordability, inflation, and sustainability require some attention in 2025 to maintain a balanced and stable market.